
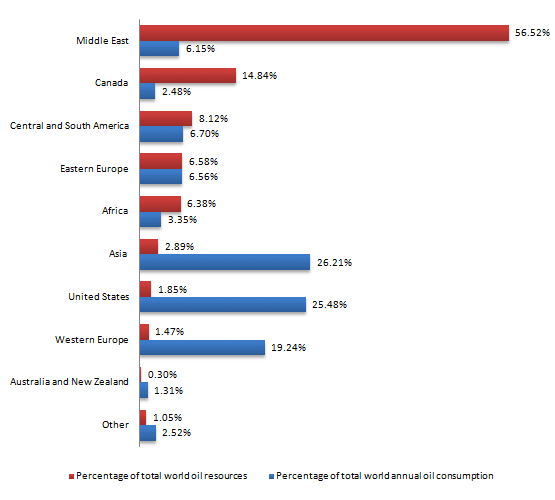
The two charts compare the amount of
oil
Use synonyms
ressources
in the world Correct your spelling
resources
in
several surfaces Change preposition
on
as well as
the annual consumption of Linking Words
this
liquid.
Linking Words
Overall
, the Asian continent has the highest percentage of the globe’s annual Linking Words
oil
consumption even though it Use synonyms
posesses
few of the liquid’s Correct your spelling
possesses
ressources
. Correct your spelling
resources
Furthermore
, Linking Words
it is clear that
the Middle East has the most important quantity of Linking Words
this
Linking Words
ressource
, but it does not consume much of it.
Indeed, Asia is responsible for more than a quarter of the Earth’s Correct your spelling
resource
oil
consumption. In Use synonyms
this
continent, 26.21% of the liquid is used each year. Linking Words
By contrast
, in most Linking Words
of
Change preposition
apply
the
areas, no more than 7% of it is consumed annually, which means that Asia uses more than 3 times as much of the natural fluid as the other countries, even though it has less than 3% of the Correct article usage
apply
ressource
.
Correct your spelling
resource
On the other hand
, the Middle East is home to more than half of the world’s Linking Words
oil
quantities. More precisely, 56.52% of it is in that area. Use synonyms
However
, it does not consume more than 7% of the fluid annually.Linking Words