
The bar graph
that is
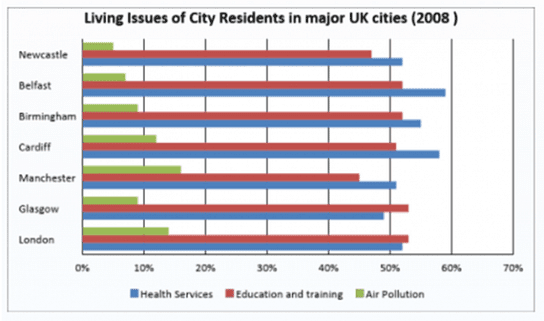
presented below demonstrates the percentage of different issues, which people from the UK can be confronted by in 2008.
Linking Words
Overall
, Linking Words
this
chart consists of three Linking Words
colored
bold lines – green, red and blue, that represent health services, education and training, and air pollution. Change the spelling
coloured
Moreover
, each of Linking Words
seven
included cities Correct article usage
the seven
from
the UK has these three lines and their personal percentage, which, as we can see, Change preposition
in
is
grown already to 60%.
Verb problem
has
According to
the graph, the blue lines Linking Words
together with
the red are the greatest for every UK town, Linking Words
that
means that medical service and studying are the most serious and principal issues in 2008. At Correct pronoun usage
which
this
point, Belfast with Cardiff have the same indications on the highest dot, Linking Words
while
other city residents have at least 50%, except for Glasgow, that have approximately 48-49% on health service and Manchester, Linking Words
which
red line is on 45%.
In comparison with red and blue, green curves determine Correct pronoun usage
whose
more
lower measures, illustrating that air pollution is in six and more times less important than other city’s problems. Beginning with Manchester and ending with Newcastle its index is decreasing – from 16% to 5%.Change the word
apply