
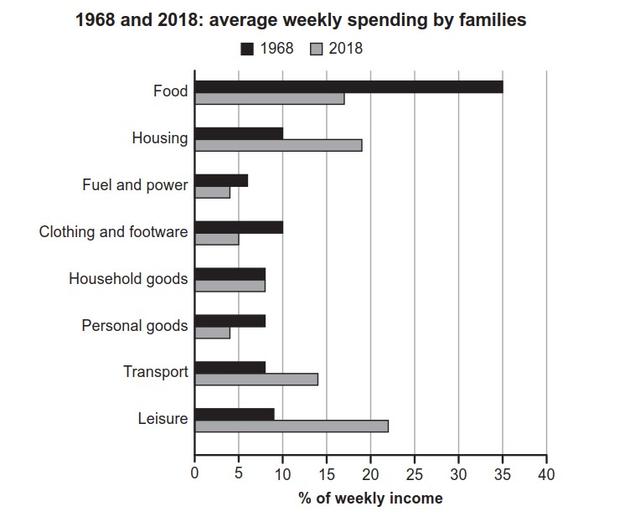
The given bar chart compares
weekly
Correct article usage
the weekly
income
spent by Use synonyms
families
Use synonyms
on
eight different categories in the Change preposition
in
year
1968 and 2018.
From the bar Fix the agreement mistake
years
chart
it is clear in 1968, Add a comma
chart,
majority
of Correct article usage
the majority
families
’ weekly Use synonyms
income
Use synonyms
were
spent on the food Change the verb form
was
category
, Use synonyms
while
Linking Words
the
fuel and power Correct article usage
apply
was
the least Change the verb form
were
category
Use synonyms
families
spent their amount of money on. Use synonyms
However
, in 2018, Linking Words
families
spent most of their money in the leisure Use synonyms
category
Use synonyms
,
and spent the lowest proportion of their Remove the comma
apply
income
on Use synonyms
the
personal goods. Correct article usage
apply
Therefore
, based on the information, we can see that in the span of 50 years, people Linking Words
has
changed their way of consumption.
In 1968, Change the verb form
have
families
spent the highest proportion of weekly Use synonyms
income
on food (35%). Use synonyms
On the contrary
, 10% was spent each on housing and clothing Linking Words
category
. Use synonyms
Furthermore
, only less than 10% was spent each on fuel/power, household goods, personal goods, transport, and leisure categories.
Linking Words
On the other hand
, in 2018, Linking Words
families
spent most of their money on the leisure Use synonyms
category
(22%), followed Use synonyms
with
Change preposition
by
housing
and food Correct article usage
the housing
category
with 18% and 16% of weekly Use synonyms
income
respectively. The rest of the categories had Use synonyms
the
spending proportion of less than 20% each.Correct article usage
a