
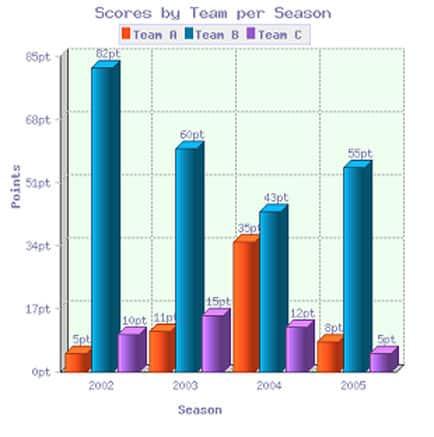
The bar chart shows the scores of
teams
A, Use synonyms
B
and Use synonyms
C
over four different seasons.
The bar chart illustrates the scores of the three Use synonyms
teams
; A, Use synonyms
B
and Use synonyms
C
in four different seasons. It's crystal clear that Use synonyms
team
Use synonyms
B
scored far higher than the other two Use synonyms
teams
all the seasons but Use synonyms
also
it slowly decreased over these time periods.
Linking Words
Overall
, we can clearly see that Linking Words
teams
A and Use synonyms
C
were lower than Use synonyms
team
Use synonyms
B
in all years ( 2002,2003,2004 and 2005) and it goes like Use synonyms
this
in all years.
Taking a closer look at 2002, the score of Linking Words
team
Use synonyms
B
exceeded that of the other two Use synonyms
teams
. Use synonyms
Team
A had 5 Use synonyms
points
and Use synonyms
team
Use synonyms
C
had 10 Use synonyms
points
. After the Use synonyms
year
2002, Use synonyms
team
Use synonyms
B
slowly decreased Use synonyms
year
by Use synonyms
year
but it still remained above the Use synonyms
points
of the other Use synonyms
teams
.
Use synonyms
However
, Linking Words
teams
A and Use synonyms
C
were rising after 2003. In fact, in 2004, Use synonyms
team
Use synonyms
B
almost caught up with Use synonyms
Team
A but there were still 8 Use synonyms
points
so they couldn’t. Use synonyms
Linking Words
However
sadly Add a comma
However,
team
Use synonyms
C
had always the lowest Use synonyms
points
than the other two Use synonyms
teams
so it was always at the lowest part of the chart.
In the final Use synonyms
year
, all Use synonyms
teams
were decreased from the other three years. Even though when we look at the other Use synonyms
teams
Use synonyms
team
Use synonyms
B
still had the highest score. Use synonyms
While
Linking Words
teams
A and Use synonyms
C
saw their point scores reverse and drop 8 and 5 Use synonyms
points
respectivelyUse synonyms