
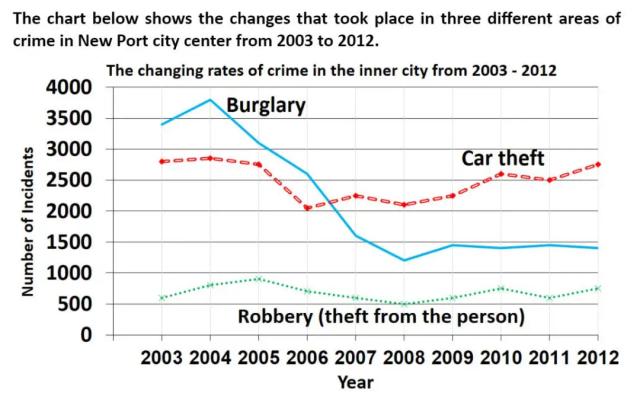
The line graph illustrates the changes in the proportion of three areas that took place of crime in New Port City (Burglary, Car theft and Robbery) over the 9-year period ending in 2012. Generally speaking,
it is clear that
the gap in criminal changes between the three areas was large in the beginning, Linking Words
however
, the gap became smaller over time.
Linking Words
Firstly
, the number of incidents of Burglary grew vitally from 3500 to 3800. After that, it was dropped dramatically to 1000 from 2004 to 2008. As a Linking Words
resuit
, it remained constant at around 1500 which is just above the rate of Robbery and below car theft.
Correct your spelling
result
Furthermore
, for the case of automobile theft ,it was kept between 2000 to 3000 over time. The major change is the number of car thefts reduced suddenly from 3000 to 2000 in the third year. Linking Words
In contrast
, there was no important motivation in the number of accidents in robbery as it was kept between 500 to 1000 cases over time.Linking Words