
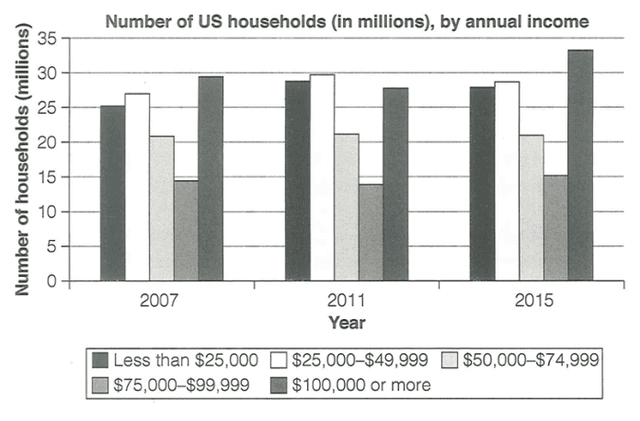
The presented line graph indicates information about the number of US
households
by annual revenue from 2007 to 2011 and 2015. The unit measurement is in millions. Use synonyms
Overall
, it can be seen that people who earned 100k USD or more experienced the most fluctuation rather than Linking Words
rest
of them.
Moving to more Correct article usage
the rest
detailed
, it is considerable that families who earned between 25k and 49k dollars had a small gap in these periods with families who earned 25,000 dollars or below. Both of these charts Replace the word
detail
has
stayed between 25-30 Correct subject-verb agreement
have
million
during these 3 periods and both of their pick levels were in 2011.
Use synonyms
According to
the demonstrated information, Linking Words
population
of families with 50,000 to 74.999 USD has steadily stayed Add an article
the population
on
20 Change preposition
at
million
. Use synonyms
Whereas
, Linking Words
number
of Correct article usage
the number
households
with 75,000 to 99,999 USD has slightly fluctuated from 2007 to 2015. Use synonyms
Population
of Add an article
The population
households
with the highest revenue increased from 28 Use synonyms
million
in 2007 to 33 Use synonyms
million
. As you can see, the highest amount of Use synonyms
households
Use synonyms
belongs
to these people who can earn much more than Change the verb form
belong
rest
of them.Correct article usage
the rest