
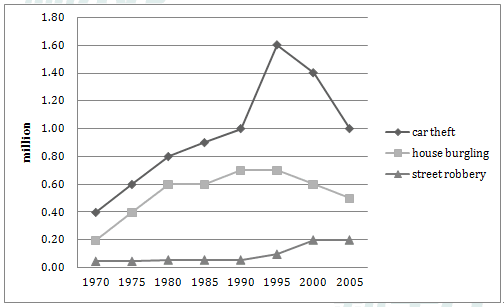
Looking at the chart , the rate of three different crimes in England and Wales from 1970 to 2005 can be observed. What is noticeable,is that car thefts were the most common over a 35-year timeframe,
whereas
street robberies were rarely committed.
Linking Words
To begin
with, from 1970 to 1990 the level of car theft increased more than twice from 0.40 to 1 Linking Words
million
,followed by dramatic growth to1,6 Use synonyms
million
in 1995. Use synonyms
However
, the rate declined sharply and in 2005 indicator was similar to that in 1990. Linking Words
In contrast
, robbery was not so widespread,because the chart demonstrates that from 1970 to 1990 it was not committed ,Linking Words
nevertheless
, in 2005 a slight growth can be seen.
Looking more closely, the house burgling commitment rate varied throughout 35 years. Linking Words
For example
, from 0.2 Linking Words
million
in 1970,the digit tripled to 1995, with the following decrease in 2005, when the number was nearly half of a Use synonyms
million
.
Use synonyms
Overall
, if Linking Words
this
tendency continues ,it will lead to considerable growth in the street robbery commitment.Linking Words