
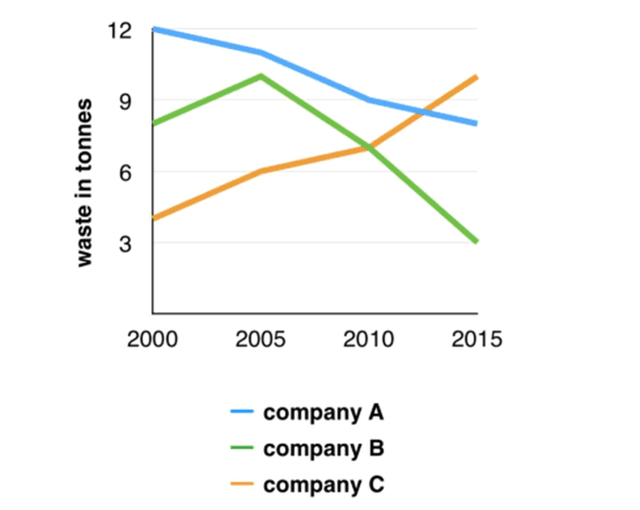
The line chart illustrates the accounts of
waste
produced by several companies during the period from 2000 to 2015.
It is noticeable that only Use synonyms
Company
Use synonyms
C
increased over a period of 15 years. Use synonyms
By contrast
, in the end, the Linking Words
waste
produced in Use synonyms
company
A and Use synonyms
company
Use synonyms
B
decreased between 2000 and 2015.
In 2000, the highest Use synonyms
waste
generated by Use synonyms
Company
A which was reached 12 Use synonyms
tonnes
. Use synonyms
Moreover
, Linking Words
Company
A can reduce Use synonyms
waste
Use synonyms
production
year by yearUse synonyms
that was
falling from 12 Verb problem
,
tonnes
to approximately Use synonyms
tonnes
in 2015. Use synonyms
Furthermore
, the Linking Words
waste
generation by Use synonyms
company
Use synonyms
B
had increased by 2 Use synonyms
tonnes
in a half-decade. After that, the amount of Use synonyms
waste
produced by Use synonyms
Company
Use synonyms
B
significantly decreased from closer to 10 Use synonyms
tonnes
to 3 Use synonyms
tonnes
over a decade.
Use synonyms
Furthermore
, Linking Words
company
Use synonyms
C
which had lower Use synonyms
waste
Use synonyms
production
in 2000 generated closer to 5 Use synonyms
tonnes
. Use synonyms
In addition
, the Linking Words
waste
generated by Use synonyms
company
Use synonyms
C
rose between 2000 and 2015. Use synonyms
Moreover
, the gap between Linking Words
Company
Use synonyms
C
and Use synonyms
Company
Use synonyms
B
was 4 Use synonyms
tonnes
in 2000 but in 2010, the Use synonyms
waste
Use synonyms
production
by Use synonyms
Company
Use synonyms
C
and Use synonyms
Company
Use synonyms
B
had the same value of Use synonyms
waste
generated which was approximately 7 Use synonyms
tonnes
. In 2015, the highest Use synonyms
waste
Use synonyms
production
had been replaced by Use synonyms
company
Use synonyms
C
.Use synonyms