
This
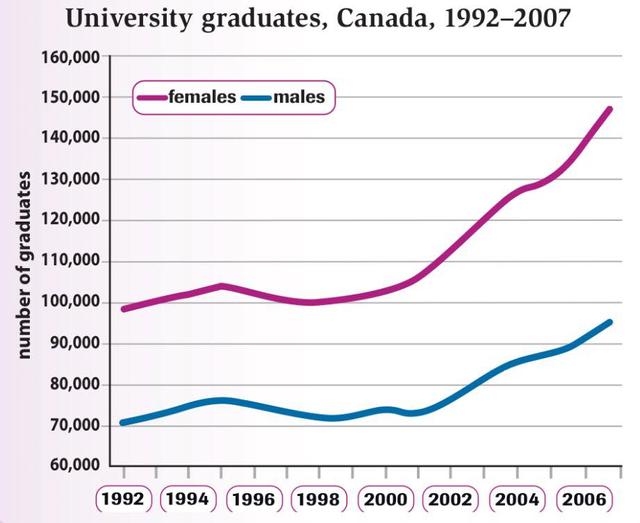
line graph provides information about the rate of university certificates for different genders in Canada during the period from 1992 to 2007. Linking Words
Overall
,Linking Words
it is clear that
the highest digit of student
certificates were in 2007, Linking Words
whereas
the number of Linking Words
graduates
in 1992 was the lowest.
It can be deduced from the line graph that university Use synonyms
graduates
increased slightly from 70,000 in 1992 to around 60 Use synonyms
thousand
in 1995. If we compare the digits of boys and girls, we notice that females were the highest, Use synonyms
while
males were the lowest. Linking Words
For instance
, in 2007, male students graduated approximately 90 Linking Words
thousand
, Use synonyms
however
, the number of females was just under 150 Linking Words
thousand
in the following years. it is interesting to notice that the digit of Use synonyms
graduates
fell slowly in 1995. Use synonyms
For example
, it was 105 Linking Words
thousand
in 1995 Use synonyms
then
became under 80,000 in 1999 for male Linking Words
graduates
.
In conclusion, female Use synonyms
graduates
were the highest, but the lowest digit of Use synonyms
graduates
were males.Use synonyms