
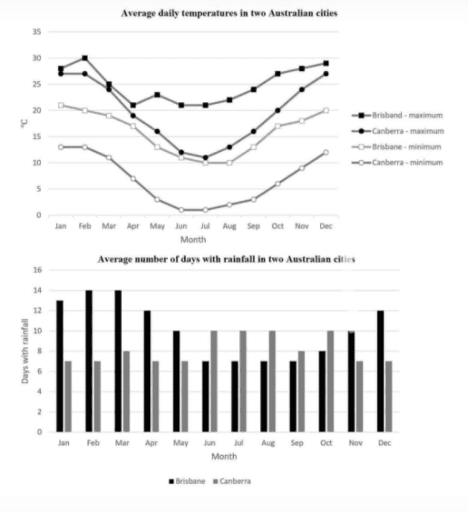
The line graph displays the high and low temperatures every day in degree Celsius in two regions in Australia and the bar chart illustrates the percentage of rainy days monthly there.
Overall
, it is evident that the weather in the earlier and later months in Linking Words
Brisbane
and Use synonyms
Canberra
is quite hot. Use synonyms
Besides
, the amount of rainfall in Linking Words
Brisbane
is higher than in Use synonyms
Canberra
in several months, except from June to October.
Regarding the daily temperatures, in the first six-month both areas kept falling significantly until July; Use synonyms
however
, these two places witnessed a maximum temperature of 30 Celsius Linking Words
degrees
and 27 Use synonyms
degrees
, Use synonyms
while
the minimum figures for Linking Words
Brisbane
are only 10 Use synonyms
degrees
and Use synonyms
Canberra
is just above 0 Use synonyms
degrees
. Over the second half of the year, the climate gets hotter as the average temperature increases noticeably. Use synonyms
Whereas
Linking Words
Brisbane
and Use synonyms
Canberra
reach a high of nearly 30 Celsius Use synonyms
degrees
, the minima are 20 Use synonyms
degrees
and 12 Use synonyms
degrees
, respectively.
Turning to the average number of rainfall, in Use synonyms
Brisbane
, February and March are recorded at the top of the list with 14 rainy days, followed by January, April as well December. Meanwhile, the period with rain during summer stands at only a week. Use synonyms
By contrast
, between June and October, the proportion in Linking Words
Canberra
is the highest with over a week raining, compared to approximately 7 days in other months.Use synonyms