
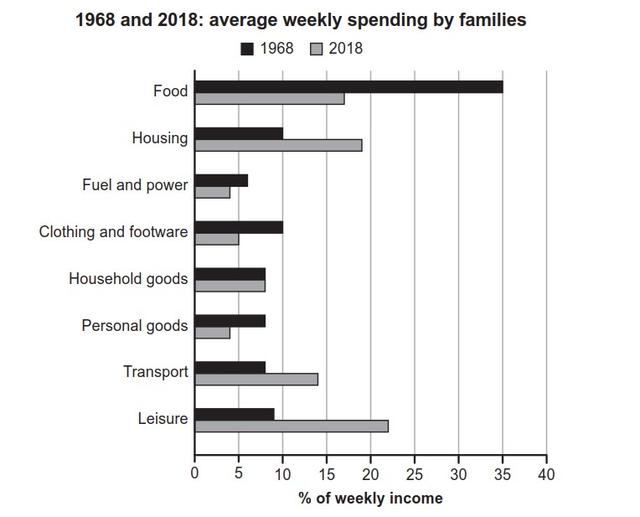
The presented chart indicates some data about the average revenue consumed by families every week from 1968 to 2018.
Overall
, it can be seen that the most progressive trend belongs to the food, Linking Words
whereas
the people`s income for household goods has been stable after these 50 years.
Considering the people`s income on the housing and the leisure, these categories revenue has been drastically increased from approximately 10% to 20%. Money consumption for Fuel and power and personal goods has slightly dropped from about 14% to 4%. It seems remarkable that the most decrease happened in Clothing which was halved during these years.
In conclusion, we can figure out that nowadays, most people spend their salaries on their leisure activities. Linking Words
While
people were keen on spending their income to buy food for themselves.Linking Words