
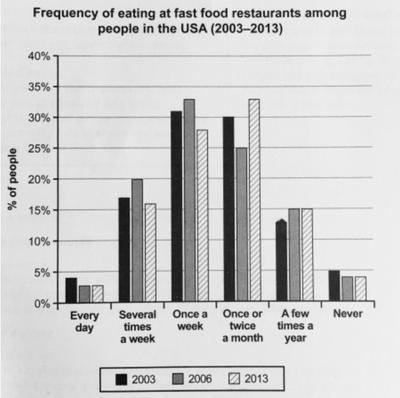
The bar chart compares the frequency that Americans going to fast
food
Use synonyms
restaurants
in 2003, 2006 and 201 by showing the percentages of people.
Use synonyms
Overall
, the vast majority of consumers in the USA went to fast Linking Words
food
Use synonyms
restaurants
once a week in 2003 and 2006 Use synonyms
while
the frequency reduced to once or twice a month in 2013.
Linking Words
According to
the information shown in the diagram, over 30% of customers in the USA were in fast Linking Words
food
Use synonyms
restaurants
once a week in 2003 and 2006. Use synonyms
However
, there were only around 28% of them went to fast Linking Words
food
Use synonyms
restaurants
in 2013 and most of them were in Use synonyms
this
kind of restaurant once or twice a month which was around 5% higher. Linking Words
By contrast
, less than 5% of people in the USA went to fast Linking Words
food
Use synonyms
restaurants
every day at the given time which was even lower than the percentage of Americans who never went to a fast Use synonyms
food
restaurant.Use synonyms