
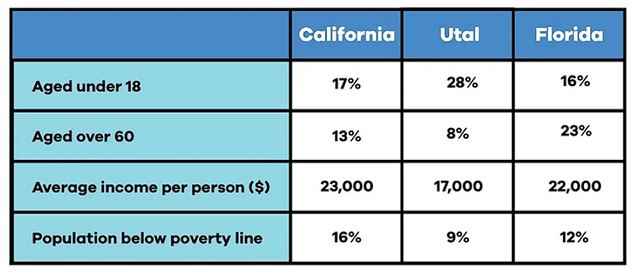
The chart above shows data on three states in the United States:
California
, Use synonyms
Utah
, and Use synonyms
Florida
. The chart displays information about age distribution, average Use synonyms
income
per person, and Use synonyms
poverty
rates.
In terms of age distribution, Use synonyms
Utah
has the highest percentage of young people, with 28% of its Use synonyms
population
under 18. Use synonyms
Florida
, Use synonyms
on the other hand
, has the highest percentage of people over the age of 60, with 23% of the Linking Words
population
falling into Use synonyms
this
category. When compared to Linking Words
Utah
, Use synonyms
Florida
has almost three times as many people over 60. Use synonyms
California
falls in the middle, with intermediate percentages of both young and old populations.
In terms of average Use synonyms
income
per person, Use synonyms
California
has the highest value, with an average of $23,000. Use synonyms
Florida
follows closely behind, with an average Use synonyms
income
of $22,000, Use synonyms
while
Linking Words
Utah
has the lowest average Use synonyms
income
at $17,000. The difference between Use synonyms
California
and Use synonyms
Florida
is only $1,000. Use synonyms
However
, despite having a high average Linking Words
income
, Use synonyms
California
has the highest rate of Use synonyms
poverty
, with 16% of its Use synonyms
population
falling below the Use synonyms
poverty
line. Use synonyms
In contrast
, Linking Words
Utah
, despite having a lower average Use synonyms
income
, has a better Use synonyms
poverty
rate, with only 9% of its Use synonyms
population
living below the Use synonyms
poverty
line, compared to 12% in both Use synonyms
California
and Use synonyms
Florida
.Use synonyms