
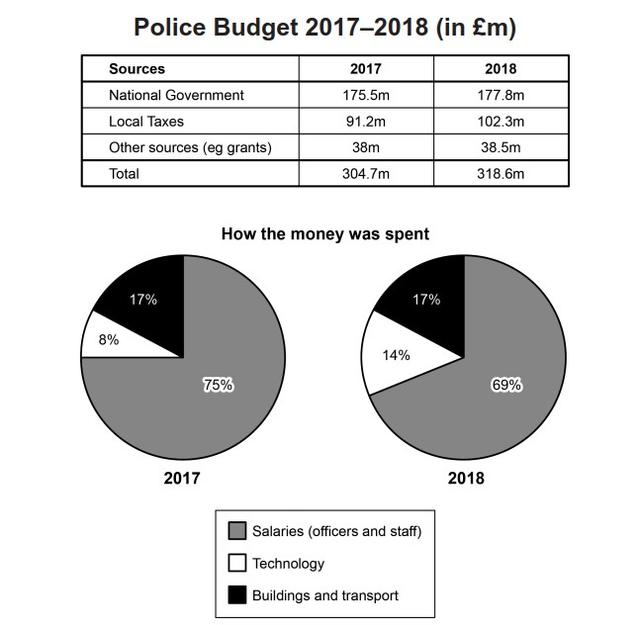
The table displays the police expenditure in 2017 and 2018 in Britain,
while
the pie chart illustrates its distribution.
Linking Words
Overall
, Linking Words
it is clear that
their budget increased during Linking Words
this
time frame, with the national government becoming their primary source. Linking Words
In addition
, the majority of the money was used to pay officers and staff.
Looking at the details of the first graph, 175,500,000 euros came from the national authority in 2017, which was by far the greatest amount among others. By the next year, Linking Words
this
number had risen by roughly two million. The entire spending plan Linking Words
also
followed the same pattern, starting at 305.7 m and finishing at 318.6 m.
Moving to the next diagram, the third quarter of funds was utilized for salaries, which was the largest proportion among others. In the following years, Linking Words
this
figure dropped to 69%, Linking Words
although
it still emerged as the biggest allocation. Linking Words
However
, those in technology showed an upward trend, beginning at 8% and growing to 14% in the final year. Linking Words
Moreover
, those in buildings and transport remained relatively stable, accounting for 17% of the total for both periods.Linking Words