
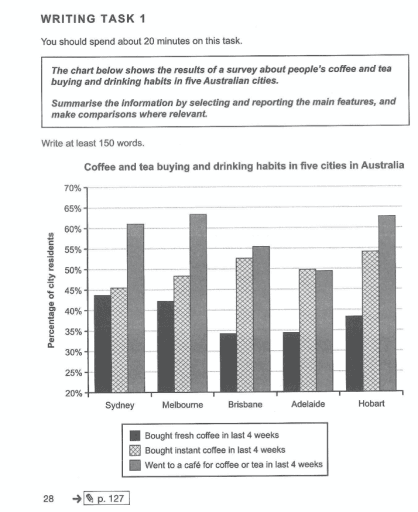
The bar chart compares the percentages of people in five cities in Australia in terms of their tea and
coffee
purchasing and drinking habits over a 4-week period.
Use synonyms
Overall
, what stands out from the graph is that a significant proportion of people chose to buy instant Linking Words
coffee
and go to cafes. Use synonyms
In contrast
, purchasing fresh Linking Words
coffee
is the least prevalent option.
Regarding the chart, the share of those who visited cafes was almost the same in Sydney, Melbourne, and Hobart, ranking first with more than 60%, Use synonyms
while
those figures for Brisban and Adelaide were responsible for the least share, with nearly 55% and 40%, respectively.
Focusing on other choices, as given in the diagram, the disparity between buying fresh and instant Linking Words
coffee
was almost the same in Brisban, Adelaide, and Hobart by a margin of nearly 25%, Use synonyms
whereas
that in Sydney and Melbourne accounted for less than 5%, as in the former people purchased instant Linking Words
coffee
had the highest share with 45%, those in the latter accounted for the largest percentage with approximately a half of the city population.Use synonyms