
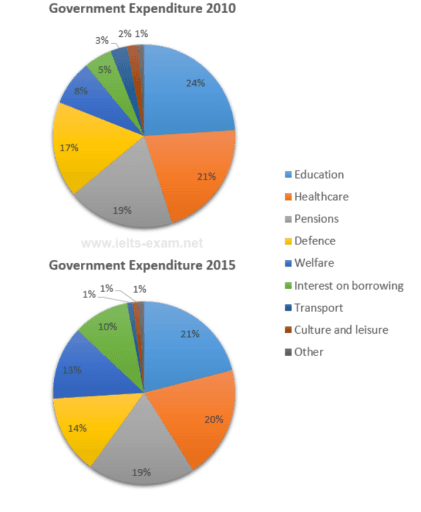
The slices of the pie chart illustrate local authorities spent in 2010 and 2015. The data is presented in the form of various sectors that were expended by the government.
Overall
, it may be stated that the highest consumed of twenty-four Linking Words
percent
by the government on education. Change the spelling
per cent
Also
, the lowest part of one Linking Words
percent
was invested by the government in transport, culture, leisure activities, and others in both years.
It’s crystal clear from the pie chart that a major percentage of 24% was covered by education. Change the spelling
per cent
Also
, the education and healthcare sectors occupied a ratio of the same in both years Linking Words
as well as
healthcare lost a ratio of one in 2015. Linking Words
In addition
, the pension sector maintained its position the same as 19% in the previous years.
Linking Words
On the other hand
, the area of interest on borrowing doubled in 2015 to 10%. Linking Words
Moreover
, the Linking Words
defense
lost three Change the spelling
defence
percent
of its investment in 2015, and the welfare increased funding to 5% in 2015. Change the spelling
per cent
Furthermore
, transport, culture, leisure activities, and others decreased by a ratio of one and two.Linking Words