
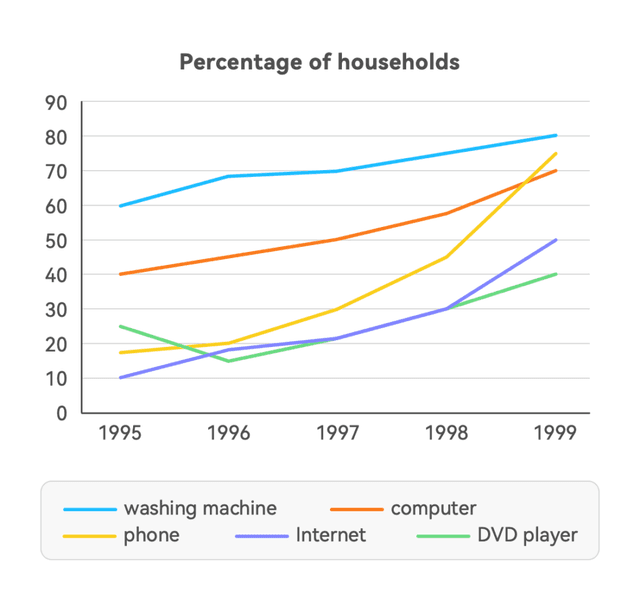
The line graph
provide
information about the proportion of domestic use with various Change the verb form
provides
type
of technology in Fix the agreement mistake
types
United
Correct article usage
the United
State
between 1995 and 1999. Fix the agreement mistake
States
Overall
, all of the technological Linking Words
adoption
were upward trends during Change to a plural noun
adoptions
this
period.
Looking at the data in more detail, it can clearly be seen that the highest percentage was washing Linking Words
machine
starting from 60 Fix the agreement mistake
machines
Use synonyms
percent
and Change the spelling
per cent
this
figure Linking Words
inceased
marginally to 80 Correct your spelling
increased
Use synonyms
percent
in 1999. The second increment was Computer machines rose Change the spelling
per cent
steady
Change the adjective
steadily
at
40 Change preposition
from
Use synonyms
percent
to around 70 Change the spelling
per cent
Use synonyms
percent
. Change the spelling
per cent
Furthermore
, the number of Linking Words
phone
was Change to a plural noun
phones
dramatical
Change the adjective
dramatically
inclined
and reached Correct your spelling
increased
to peck
almost 75 Verb problem
apply
percent
, which is more than Use synonyms
computer
and Fix the agreement mistake
computers
became to
second place.
Verb problem
came
Moved
ahead, in Wrong verb form
Moving
term
of DVD player, in the first year the graph declined slightly from 25 Fix the agreement mistake
terms
Use synonyms
percent
to 15 Change the spelling
per cent
Use synonyms
percent
Change the spelling
per cent
then
soared significantly to a peak at 40 Linking Words
Use synonyms
percent
during after Change the spelling
per cent
4 year
period. Add a hyphen
4-year
Additional
, the percentage of the internet was marginal grew at the Change the word
Additionally
begining
at 10 Correct your spelling
beginning
Use synonyms
percent
to under 20 Change the spelling
per cent
Use synonyms
percent
Change the spelling
per cent
then
Linking Words
steady
remained from the year 1996 to 1997 and climbed moderately to 50 Change the word
steadily
Use synonyms
percent
, which is more than DVD players.Change the spelling
per cent