
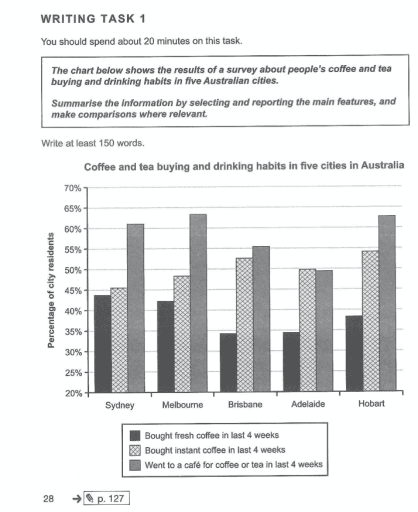
The diagram illustrates how much
coffee
and tea was bought by people in five Use synonyms
cities
in the Use synonyms
last
4 weeks and their drinking tendencies.
Linking Words
Overall
, the number of people who bought fresh Linking Words
coffee
in the Use synonyms
last
4 weeks was always the lowest proportion in all categories by far. In the opposite data, the figure for going to a coffeehouse for Linking Words
coffee
or tea was seen as highest in 4 Use synonyms
cities
, except for Adelaide, where residents would love to buy instant Use synonyms
coffee
Use synonyms
than
going to a particular place or having fresh ones.
Regarding Melbourne, Sydney, and Hobart, their preference for going to a cafe for Rephrase
rather than
coffee
or tea was over 60% highest Use synonyms
ones
compared to the amount from two other Fix the agreement mistake
one
cities
Brisbane around 55%, and especially in Adelaide only under 50%. Use synonyms
In addition
, there was a trend in buying instant Linking Words
coffee
in Adelaide at exactly 50%, which was still smaller than 5% in Brisbane and Hobart. The figures for the remaining Use synonyms
cities
were about 46%.
Over 40% of people prefer to order fresh Use synonyms
coffee
in two Use synonyms
cities
Sydney and Melbourne, as opposed to only under 40% in Hobart and even under 35% in the two Use synonyms
last
Linking Words
cities
.
.Use synonyms