
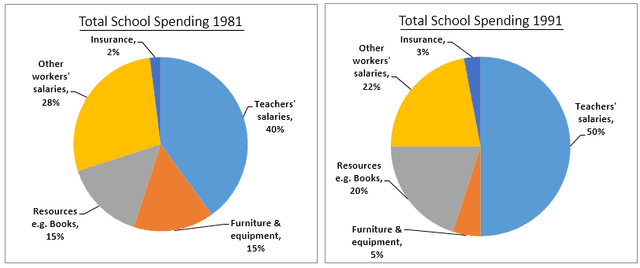
The graphs display the amount of change in annual expenditure by a particular school in England in three separate years, 1981, 1991 and 2001.
Overall
, the largest proportion of total school expenditures was allocated to teacher Linking Words
salaries
in 1991, meanwhile, that of insurance expenses was the lowest in 1981.Between 1981 and 2001, there was a significant decrease in costs related to resources like books and other workers' Use synonyms
salaries
.
In all three years, the greatest expenditure was allocated to the Use synonyms
salaries
of instructors and it reached its peak, which was 50%, in 1991. But Use synonyms
while
, in 1981, 28% of total school expenses were paid for Linking Words
salaries
of other workers, over the following 20 years, that of workers Use synonyms
salaries
fell dramatically (15%). Despite the fact that the cost of resources Use synonyms
such
as books had risen to 20% by 1991, it was merely 9% Linking Words
at the end
of the period.
In 1991, furniture and equipment expenditures went down only a very small number of total expenditures and more than quadrupled in 2001. Linking Words
Similarly
, the cost of insurance saw a rising trend, growing only 2% to 8% by 2001.Linking Words