
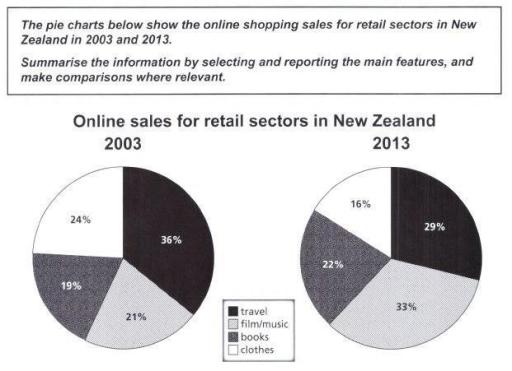
The pie chart illustrates the sales of online shopping for retail fields in New Zealand from 2003 until 2013. There are four categories,
such
as books, film/music, clothes, and travel. The unit measurement is in percentage.
Linking Words
To begin
with, film/music is the category that experienced a drastic jump from 22% to 33% in 2013. Linking Words
This
growth phenomenon made film/music become the first category to be bought online. Linking Words
Similarly
, books Linking Words
also
rose by approximately 22% in the same year.
Linking Words
On the other hand
, regardless of a strong start with 37% in 2003, travel had fallen by quite a lot after 10 years with just 29%. Linking Words
Next,
people's preference to buy clothes online Linking Words
also
changed in another direction. Linking Words
Thus
, clothes had decreased to just a mere 16% in 2013.
Linking Words
Overall
, the proportion of changes in the four categories is fifty-fifty. Linking Words
Nonetheless
the dramatic fall in 2010, people's preference to buy travel online still remained second.Linking Words