The graph below shows the number of shops that closed and the number of new shops that opened in one country between 2011 and 2018. Summarise the information by selecting and reporting the main features, anomake comparisons where relevant.

The graph below shows the number of shops that closed and the number of new shops that opened in one country between 2011 and 2018.

Summarise the information by selecting and reporting the main features, anomake comparisons where relevant.
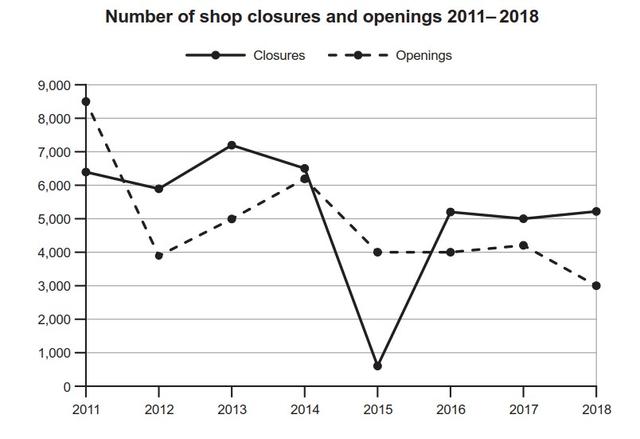
The line charts illustrate the number of outlets that had closed and opened between 2011 and 2018.
Overall
, it is clear from the data above that in 2015 a significant total of closed outlets was noticed and measured at approximately 800.
While
, in 2011 opened shops were selected to be the highest, with 7000
stores
. As shown by the graph, there was a sharp decrease starting from 2011 and ending in 2012, with a losing amount of 3000
stores
. The number of showrooms remained in a steady state noticed in three years 2015, 2016 and 2017 with 4000
stores
.
However
, the closed and the opened
stores
had almost the same numbers in 2014, around 6100.
On the other hand
, in 2012 the total opened market started to increase and reached 6000 in 2014 ,
then
it went back to the same value in 2015. Followed by no changes from 2016 until 2018
Submitted by khaleefalkhalaf on

Unauthorized use and/or duplication of this material without express and written permission from this site’s author and/or owner is strictly prohibited. Excerpts and links may be used, provided that full and clear credit is given to Writing9 with appropriate and specific direction to the original content.

Vocabulary: Rephrase your introduction. Words match: 69%.
Vocabulary: Replace the words stores with synonyms.
Vocabulary: Rephrase the word "number of" in your introduction.
Vocabulary: The word "number of" was used 2 times.
What to do next:
Look at other essays: