
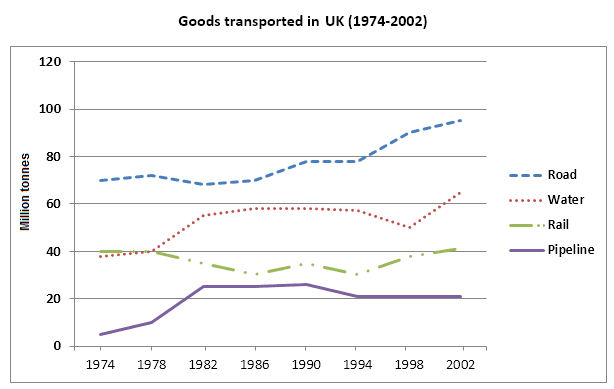
The given line graph illustrates how much quantities of goods were transported by four ways namely
Road
, Water, Rail, and Use synonyms
pipeline
in the UK, over the period of from 1974 to 2002.
Use synonyms
Overall
, Linking Words
it is clear that
Linking Words
Use synonyms
Correct article usage
the Road
Road
Correct your spelling
Roadway
way
of Use synonyms
transportation
was the most popular than any other Use synonyms
Use synonyms
methods
. Fix the agreement mistake
method
While
Linking Words
Pipeline
was the least popular.
In detail, Use synonyms
Use synonyms
Correct article usage
the Road
Road
Correct your spelling
Roadway
way
of Use synonyms
transportation
was situated at around 70 Use synonyms
million
Use synonyms
tonnes
meanwhile Use synonyms
Use synonyms
pipeline
had only almost 2 Correct article usage
the pipeline
million
Use synonyms
tonnes
in 1974. Use synonyms
Road
Use synonyms
methods
increased Significantly from the beginning of the Use synonyms
year
to Use synonyms
end
of the Correct article usage
the end
year
, between 70 to near go Use synonyms
Use synonyms
million
Change the article
a million
tonnes
- Use synonyms
water
Correct your spelling
waterway
way
of goods Use synonyms
transportation
had almost 39 Use synonyms
million
Use synonyms
tonnes
meanwhile Rail ways had Use synonyms
at
40 Change preposition
apply
million
Use synonyms
tonnes
Use synonyms
then
these two Linking Words
methods
were touched in the following Use synonyms
year
, which was 40 Use synonyms
million
Use synonyms
tonnes
. There Use synonyms
afters
Correct your spelling
after
water
Correct your spelling
waterway
way
rose slightly, Use synonyms
at
around 59 Change preposition
to
million
Use synonyms
tonnes
in 1982, after that, it Use synonyms
was remain
unchanged from 1982 to1994, which accounts for 59 Change the verb form
remained
million
Use synonyms
tonnes
, Use synonyms
then
it decreased slightly by 50 Linking Words
million
and there was a rapid increase in 2002, and reached almost 62 Use synonyms
million
Use synonyms
tonnes
.
Use synonyms
On the contrary
, Rail Linking Words
methods
of Use synonyms
transportation
had a fluctuation between 1978 and 200 and it Use synonyms
was
reached Unnecessary verb
apply
at the end
of the Linking Words
year
40 Use synonyms
million
Use synonyms
tonnes
. Use synonyms
Use synonyms
Pipeline
was the least Add an article
The pipeline
way
of Use synonyms
transportation
, from 1974 to 2002, there was a stable fluctuation, between 2 Use synonyms
millions
to 20 Change to singular
million
million
Use synonyms
tonnes
.Use synonyms