The chart below gives information about the number of social networking sites people used in Canada in 2014 and 2015.

The chart below gives information about the number of social networking sites people used in Canada in 2014 and 2015.
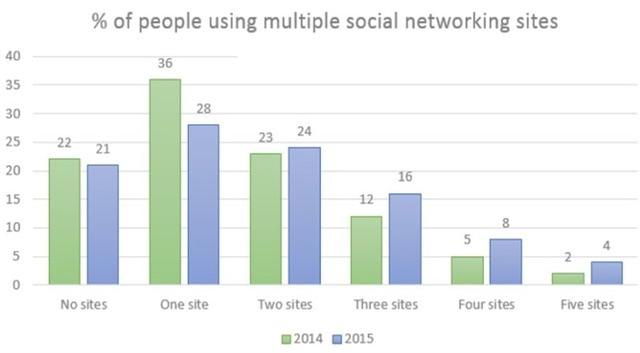
The chart illustrates how many social networking websites the Canadians used in 2014 and 2015.
Overall
, within these years, at least one site was used by most of the people of Canada
whereas
only five websites were used by the least.
In contrast
, the ratio of using them is almost the same regarding using no sites and two sites. In 2014 and 2015, only 2% and 4% of people used five social networking platforms respectively,
on the other hand
, a single site was used by 36% and 28% of citizens used one site in these consecutive years. In terms of visiting no websites, 22% persons of Canada did not use them in 2014
similarly
21% did not visit them in the next year.
However
, when it comes to using two of them, 23% used them in 2014 and 24% used them in 2015.
In addition
, if we look at four of them, we see a good difference. 5% was in 2104 and 8% was in the following year.
Submitted by safin.rizwan on

Unauthorized use and/or duplication of this material without express and written permission from this site’s author and/or owner is strictly prohibited. Excerpts and links may be used, provided that full and clear credit is given to Writing9 with appropriate and specific direction to the original content.

Basic structure: Change the third paragraph.
Vocabulary: Only 5 basic words for charts were used.
Vocabulary: Use several vocabularies to present the data in the third paragraph.
Topic Vocabulary:
  • chart overview
  • social networking sites
  • trends
  • adoption
  • comparison
  • significant changes
  • segment
  • growth or reduction
  • social media habits
  • patterns
  • multi-platform usage
  • decline
  • non-users
  • conclusion
  • digital communication
  • social media marketing
What to do next:
Look at other essays: