
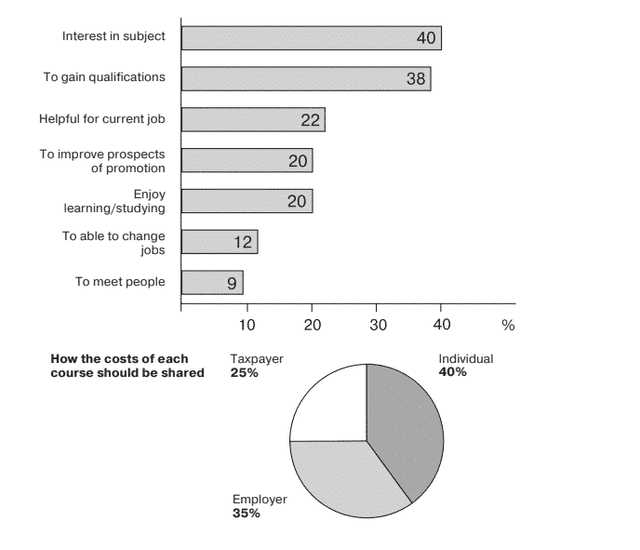
There are two visuals that portray two different data distinctively, and all of them are shown in percentages. The bar
chart
classifies several motives for why mature people opt to learn. Meanwhile, the pie Use synonyms
chart
divides the scheme of funding for adult education.
The initial Use synonyms
chart
is subsumed by seven underlying reasons for continuing study for adults. It can be separated into three divisions, which are below, around, and above 20%. The need to mingle with people came as the lowest at 9%. Followed by the opportunity of job shifting at three per cent higher. Use synonyms
In contrast
, in the above 20% group, having a particular interest is 1st ranked with almost four times bigger percentage compared to the least one. Linking Words
Subsequently
, qualification matters come afterwards with a minute difference of 2%. Linking Words
On the other hand
, reasons like an enjoyable learning process, the chance of promotion, and advantages for ongoing work are stacked up between 20 to 22 per cent, accounting for half of the first and second motives.
Turning to the pie Linking Words
chart
, which contains three responsible figures that should pay the fee for courses. Scholars believe that 40% burden of the courses' cost is the responsibility of the individual. Employers still hold the duty to give money equal to 35% of the price. Use synonyms
Last
but not least, external stakeholders like taxpayers are approximately Linking Words
one-two
of individual amounts.Correct your spelling
one to two