
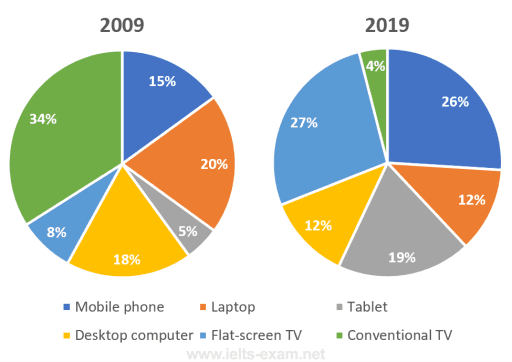
The two pie charts give information about the devices humans in the 18 to 25 age group use to watch television in Canada during a 10-year period starting in 2009.It is clear from the graph that ,
it is clear that
at the beginning of time, utilizing tablets was the Linking Words
last
thing.
Linking Words
According to
what is shown, conventional TV was significant. In comparison, Linking Words
at the end
of the period flat-screen TVs became the largest object and the lowest-used item was a desktop computer.Conventional TV comprised 34% in the first year and Linking Words
this
showed a sharp decrease of 30% to 4% in 2019. Linking Words
Likewise
, in 2009 flat-screen tv used at 8% which rose rapidly to 27% 10 years later.
Linking Words
To sum up
, we could say that, With regards to the remaining methods of using to watch , there was an approximate 15% rise in using tablets to 19%. Linking Words
On the other hand
, desktop computers declined from 6% to 12% in 2019.Linking Words