
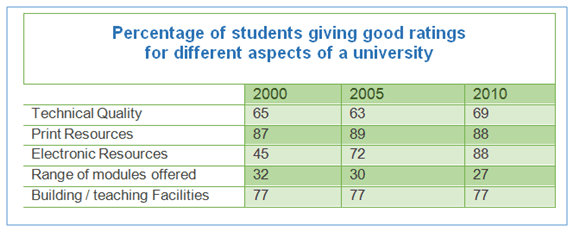
The information presented in the table indicates the proportion of students who perceived various aspects of the university in the
year
2000,2005 and 2010. In general, it is evident that the data in 2010 was higher than Fix the agreement mistake
years
Linking Words
this
in the previous Correct determiner usage
that
years
with the exception of Use synonyms
range
of modules offered by the university.
Looking at the details, teaching quality had Correct article usage
the range
the
significant proportion in three Correct article usage
a
years
. In Use synonyms
two
Correct article usage
the two
years
2000 and 2005, it had almost the same ratio Use synonyms
65
%, 63%. Change preposition
of 65
This
data rose gradually by 7% in 2010.
The most striking feature is that print resources reached a peak compared to the rest of all aspects, especially in 2005, Linking Words
the
ratio was 89%.
Another feature is that the percentage of electronic resources was more than Rephrase
when the
two fifths
in the year 2000 and it increased steeply in the following Add a hyphen
two-fifths
years
. The figure was almost doubled in 2010, 88%.
Use synonyms
In contrast
, there was a slight reduction in the range of modules offered. Linking Words
Finally
, it is interesting to note that the building/teaching facilities remained stable, 77% positive rating throughout the Linking Words
years
.Use synonyms