The pie chart shows the amount of money that a children’s charity located in the USA spent and received in one year, 2016. Summarize the information by selecting and reporting the main features and make comparisons where relevant.

The pie chart shows the amount of money that a children’s charity located in the USA spent and received in one year, 2016.

Summarize the information by selecting and reporting the main features and make comparisons where relevant.
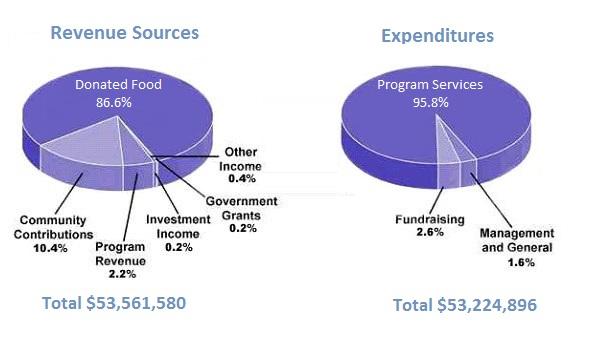
The given pie charts illustrate the amount of budgets which were collected from children's charities in the USA in 2016 and how they were consumed in the same year. From an
overall
perspective, it is evident that donated food was the primary income of the charity's revenue.
In contrast
, excepting community contributions, the sum in other categories was tiny. As can be seen in the revenue sources of these organisations, the proportion of donated food was the highest, at 86.6%. The figures for community contributions and program revenue were lower, at 10.4% and 2.2%, respectively, compared to 0.4% in that of other income.
In addition
, the data on both investment income and government grants were lowest, at 0.2%. In terms of expenditures, the percentage of program services was highest, at 95.8%.
Furthermore
, the consumptions of fundraising and management and general were 2.6% and 1.6%, in turn.
Submitted by khoihoangtrong96 on

Unauthorized use and/or duplication of this material without express and written permission from this site’s author and/or owner is strictly prohibited. Excerpts and links may be used, provided that full and clear credit is given to Writing9 with appropriate and specific direction to the original content.

Common mistake: Your writing should be 150-250 words.
Vocabulary: Rephrase the word "amount" in your introduction.
Vocabulary: Use several vocabularies to present the data in the second paragraph.
What to do next:
Look at other essays: