
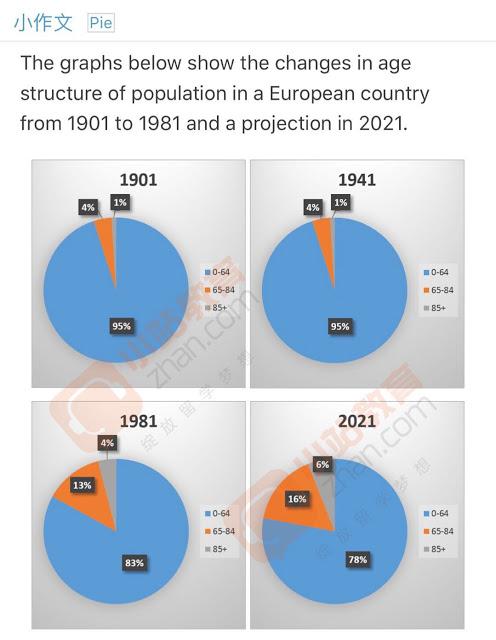
The given bar charts illustrate the change in age demographics in a European country during a period commencing in 1901 and ending in 1981, with an additional projection for 2021.
Overall
, it is rapidly apparent that people aged less than 65 years old account for the vast majority of the Linking Words
population
in Use synonyms
this
country. Linking Words
Besides
Linking Words
this
, as shown in the pie charts from 1941 onward, the Linking Words
population
of elder citizens in Use synonyms
this
country has been growing and will continue to grow.
In 1901, elderly individuals accounted for only 1% of the Linking Words
population
; in the subsequent 40 years, Use synonyms
this
figure remained the same. Linking Words
However
, from 1941 to 1981, the proportion of Linking Words
this
age group experienced a four-fold increase, and predictions show Linking Words
this
number is going to climb to 6% by 2021.
The proportion of people 65 to 85 years old significantly increased, from only being responsible for 4% of the Linking Words
population
to 13% in 4%, and predictions show Use synonyms
this
growth will continue. Linking Words
In contrast
, people aged less than 65 witnessed a substantial decline, from constituting 95% of the total in 1901 and 1945 to just 83% in 1981.Linking Words