
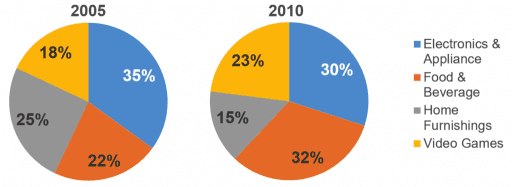
The pie chart demonstrates the percentage of internet sales in four different retail sectors in Canada in two years, namely 2005 and 2010.
From an
overall
perspective, Linking Words
it is clear that
the proportion of home furnishings and electronics and appliances experienced a downward trend, Linking Words
whereas
a reverse pattern could be seen in the figures for the two other categories over the surveyed period.
In 2005, the quantity of electronics and appliances was the largest, at 35%. The data on home furnishing and food and beverage were lower, with 25% and 20%, respectively. Video games, Linking Words
however
, accounted for the lowest number, at 18 per cent.
In the other year, there was a slight decrease in the amount of electronics and appliances to 30%. Linking Words
In addition
, the data on home furnishing rose significantly to 15% and became the least popular section bought online. Meanwhile, an increasing number of people choosing to purchase food and beverage and video games online, with 32% and 23%, respectively.Linking Words