
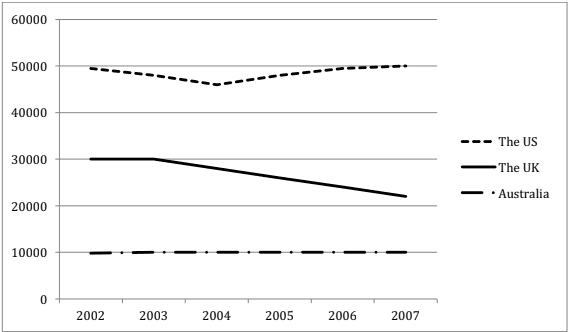
The given line graph illustrates the number of
students
who studied abroad in the US,UK and Australia between 2002 and 2007, a period of 5 years.
It can be seen that the US was the pioneer in sending Use synonyms
students
compared to 2 other countries. Use synonyms
This
rate decreased in the UK Linking Words
while
Australia remained steady.
Looking at the details, the US started with 50000 Linking Words
students
in 2002 followed by the UK with 30000. Use synonyms
Although
the US trend experienced a slight drop to around 45000 in 2004, it recovered its previous level in 2006 and remained steady toward the end of the period (2007). The latter Linking Words
leveled
out until 2003 before falling to around 21000 Change the spelling
levelled
at the end
of the period.
Linking Words
On the other hand
, the lowest number of Linking Words
students
was from Australia with 10000 Use synonyms
students
in 2002 and remained unchanged during all years.Use synonyms