
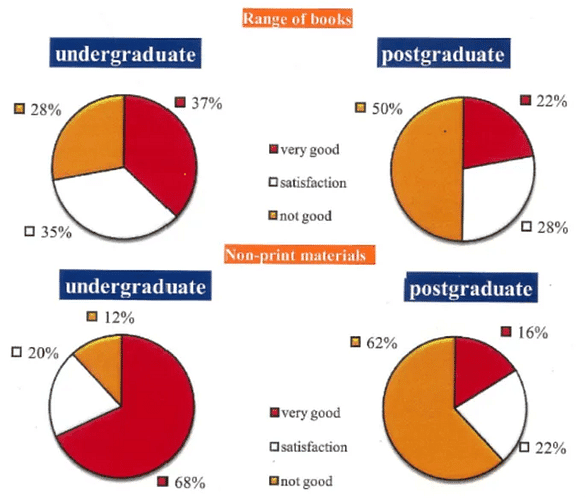
The pie charts offer insights into how undergraduates and
postgraduates
are satisfied with the Use synonyms
range
of Use synonyms
books
and non-printed Use synonyms
materials
in their school library, including 3 levels: very good, satisfaction, and not good. From an Use synonyms
overall
perspective, the proportion of undergraduate students felt very good for both a diversity of Linking Words
books
and Use synonyms
non-print
Use synonyms
materials
, Use synonyms
while
the opposite is true for postgraduate learners in both areas.
Regarding information pertaining to undergraduates, the majority of undergraduate students were satisfied at the highest level with the variety of Linking Words
books
at 37% and the Use synonyms
non-print
material at 68%, followed by satisfaction level and not good level. The former accounted for 35% of the Use synonyms
range
of Use synonyms
books
and 20% of Use synonyms
non-print
Use synonyms
materials
. The latter was allotted to 28% of the Use synonyms
range
of Use synonyms
books
and 12% of the Use synonyms
non-print
documents.
As far as the other statistics are concerned, neither the Use synonyms
range
of Use synonyms
books
nor Use synonyms
non-print
Use synonyms
materials
could satisfy most Use synonyms
postgraduates
with 50% of the variety of Use synonyms
books
and 62% of the Use synonyms
non-print
Use synonyms
materials
. The data of Use synonyms
postgraduates
felt satisfied with the Use synonyms
range
of Use synonyms
books
at 28% and Use synonyms
non-print
Use synonyms
materials
at 22%. Surprisingly, only 22% of the plenty of Use synonyms
books
and 12% of Use synonyms
non-print
documents could make Use synonyms
postgraduates
feel very good.Use synonyms