
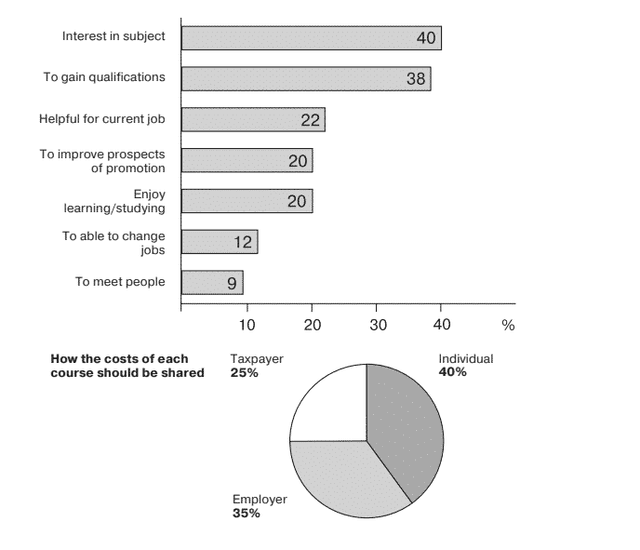
The bar graph depicts the purpose of grown people taking courses,
whereas
the pie chart illustrates the proportion of how they think the right expenses shared of a course.
Linking Words
Overall
, the interest in a particular subject and gaining qualification for their profession are the main purposes of studying. Other than that, they think the percentage for individuals should be the biggest shared for each course expense.
Linking Words
To begin
with, studying because of their interest in a specific subject and gaining qualifications to increase their job market value are the main objectives of the respondent, followed by the purpose of helping to do their existing job with 22%. Linking Words
While
improving prospects of promotion and just enjoying studying have the same percentage at 20%. Linking Words
However
, changing jobs and meeting new people stand Linking Words
last
with 12% and 9%, respectively.
Shifting to the second chart, it is apparent that grown people thought the expenditure of each course must be shared mostly for individuals and employers, with 40% and 35% consecutively. When it comes to taxpayers, they account for the smallest portion at 25%.Linking Words