
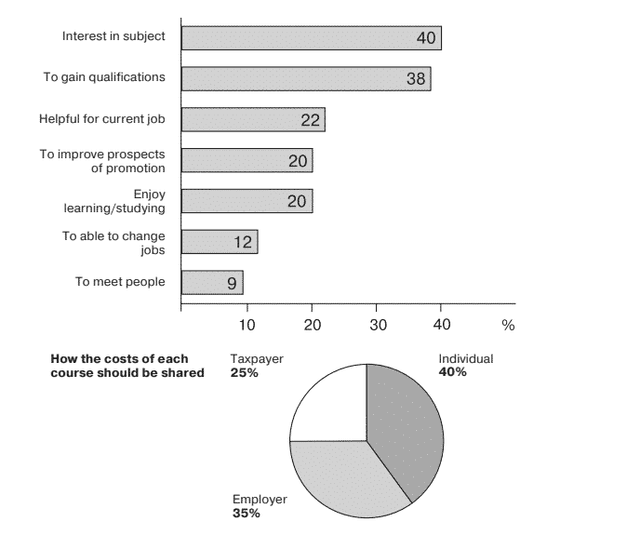
The bar chart demonstrates the reason why students choose to study,
whereas
the pie chart depicts the cost of each course.
Linking Words
Overall
, Linking Words
while
the most popular reason behind studying is deemed interest in subjects , individuals are responsible for the highest course share.
In terms of the bar graph , Linking Words
it is clear that
the adults choosing to study for interests in subjects have been reported 40 % ; Linking Words
however
, students who select to gain qualifications is smaller by a narrow margin of 2 per cent which is nearly 38% . Individuals who want to improve their prospects of promotion and enjoy studying share the same amounts of percentage with 20 %. The least amount of percentage is responsible for meeting people which is 9%.
In terms of the pie chart , it is evident that the monetary value of each course is comprised of individuals with 40% , followed by employers with 35 Linking Words
percent
which ranks second place , and the remaining 25 % is accounted for Change the spelling
per cent
taxpayers
.Change preposition
by taxpayers