
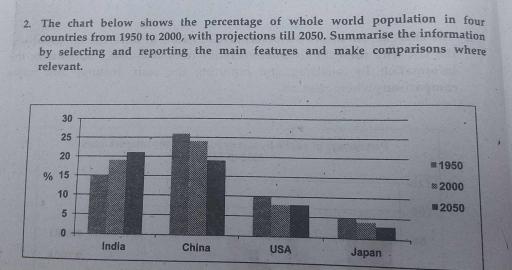
A glance at the bar chart depicts the proportion of people in four different nations (India, China, USA, and Japan) throughout the years (1950 and 2000). It
also
gives a prediction of the change in population in those countries after 26 years from now (2050).
Linking Words
Overall
, it is clear from the graph that there was a significant deterioration in population in China, the USA and Japan compared to a gradual increase in India.
In terms of China and Japan, there is a similar is a similar regressive growth pattern from around 26% to 19% and from 5% to about 3% in the same period of time (1950 to 2050), respectively. As for the USA, there is a drop in the percentage from 10% to approximately 7% between 1950 and 2000 Linking Words
while
it will possibly remain stable in the coming 26 years.
Linking Words
On the contrary
, the number of inhabitants in India grew from 15% in 1950 to less than 20% in 2000. Linking Words
Furthermore
, Linking Words
it is clear that
it will keep rising to above 20% till 2050.Linking Words