
The
supplies
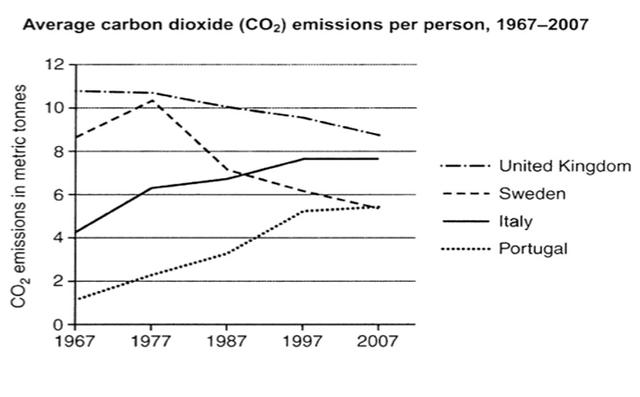
diagram illustrates the proportion of carbon dioxide emission to Change the noun form
supply
atmosphere
per individual in the UK, Add an article
the atmosphere
Sweden
, Italy, and Portugal in 1967 and 2007.
Use synonyms
Overall
, carbon dioxide emissions in Italy and Portugal rocketed up Linking Words
while
the United Kingdom and Linking Words
Sweden
plunged. Use synonyms
However
, the United Kingdom always had the highest metric Linking Words
tonnes
throughout four decades.
Use synonyms
Similarly
, Italy and Portugal had a low contribution in the first year, Linking Words
therefore
making up around 4 and 1.7 Linking Words
tonnes
respectively. Use synonyms
Nevertheless
, Italy skyrocketed to 6 Linking Words
tonnes
between 1977 and 1997, Use synonyms
whereas
Portugal saw Linking Words
the
2 Correct article usage
a
tonnes
rise from 1987 to 1997 correspondingly. Use synonyms
Furthermore
, those countries have gone up gradually and reached around 7 Linking Words
tonnes
in Italy and 5 Use synonyms
tonnes
in Portugal.
Use synonyms
On the contrary
, the United Kingdom and Linking Words
Sweden
started up with approximately similar trends. Use synonyms
On the contrary
, Linking Words
Sweden
between 1977 and 1987 saw a sharp decline Use synonyms
for
almost 4 Change preposition
of
tonnes
Use synonyms
lose
. By Replace the word
loss
that
in the Add a comma
that,
last
year Linking Words
period
it leveled off with Portugal. The UK made up an upward tendency from 11 to 9 metrics, Add a comma
period,
however
, saved its first place in the emission rate.Linking Words