
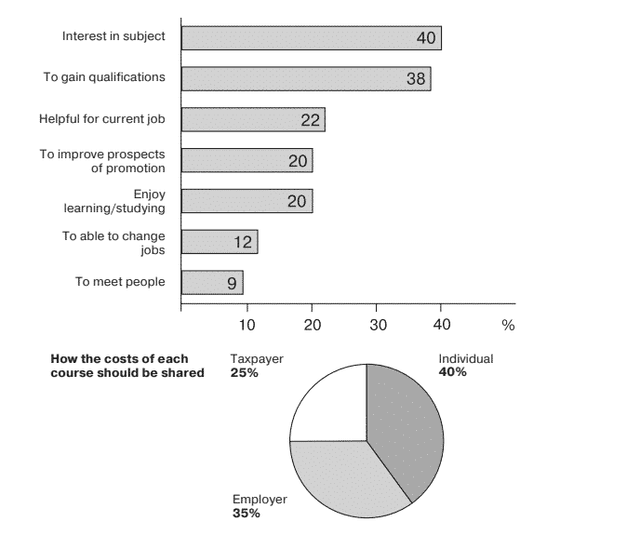
These graphs provide information about the
result
of Fix the agreement mistake
results
Correct article usage
the survay
survay
about adult education, the bar Correct your spelling
survey
graph
shows the reasons Use synonyms
for
Change preposition
apply
where
Correct word choice
why
adult
decide to study, Fix the agreement mistake
adults
along with
the proportion of shared costs of adult education. Linking Words
Overall
, it can be seen that each bar in the Linking Words
graph
shows a Use synonyms
percentage
of each reason. Use synonyms
while
the second Linking Words
garph
Correct your spelling
graph
demonstarte
a proportion of education costs that need to be shared.
In detail, in Correct your spelling
demonstrates
first
Correct article usage
the first
Use synonyms
graph
the interest in Add a comma
graph,
subject
and Correct article usage
a subject
to gain
qualification demonstrate the highest Change the verb form
gaining
percentage
, Use synonyms
in contrast
to Linking Words
Correct article usage
the meest
meest
people which shows the lowest Correct your spelling
most
percentage
.
Moving Use synonyms
in to
the pie Join the words
into
graph
, Use synonyms
individual
shows the highest Correct article usage
the individual
percentage
Use synonyms
to pay
the cost of Change preposition
of paying
eductation
Correct your spelling
education
by
around 40%, Change preposition
apply
afterthat
is the employer Correct your spelling
after that
by
around 35%, Change preposition
at
the
taxpayer Correct word choice
and the
recoreds
the lowest Correct your spelling
records
recorded
percentage
.Use synonyms