
The
line
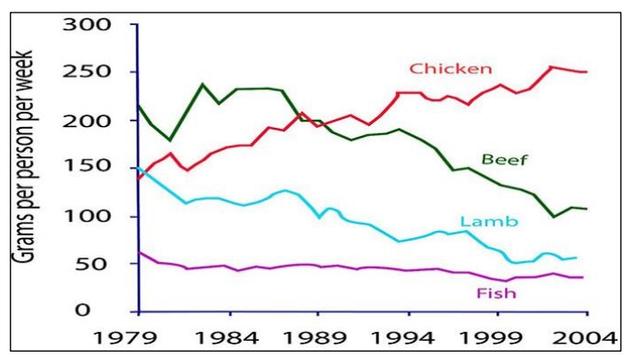
graph shows how the consumption of different kinds of meats has changed from 1979 to 2004.
Use synonyms
Overall
, the Linking Words
line
of Use synonyms
chicken
meat shows an increased Use synonyms
trend
Use synonyms
while
the lines of beef, lamb and fish meats show a decreased Linking Words
trend
in high or low levels.
Use synonyms
Firstly
, the beef Linking Words
line
shows the highest consumption of over 200 Use synonyms
grams
Use synonyms
p
.Use synonyms
p
. per Use synonyms
week
in 1979 Use synonyms
then
it reached its maximum peak in 1982 approximately from there there was a fall Linking Words
trend
where it found its lower consumption of over 100 Use synonyms
grams
pp per Use synonyms
week
in 2004. The Use synonyms
chicken
Use synonyms
line
shows the opposite Use synonyms
trend
than the Use synonyms
line
beef which means the Use synonyms
chicken
Use synonyms
line
had an increasing Use synonyms
trend
from 1979 to 2004 Use synonyms
this
Linking Words
trend
started with almost 150 Use synonyms
grams
Use synonyms
p
.Use synonyms
p
. per Use synonyms
week
in 1979 Use synonyms
then
ended with 250 Linking Words
grams
Use synonyms
p
.Use synonyms
p
. per Use synonyms
week
. Despite the lamb and Use synonyms
chicken
Use synonyms
line
starting with the same quantity of Use synonyms
grams
around 150 Use synonyms
grams
Use synonyms
p
.Use synonyms
p
. per Use synonyms
week
in 1979 the Use synonyms
trend
of the lamb Use synonyms
line
decreased ending in over 50 Use synonyms
grams
Use synonyms
p
.Use synonyms
p
. per Use synonyms
week
in 2004. Use synonyms
Finally
, the fish Linking Words
line
shows a constant Use synonyms
trend
that kept around 50 Use synonyms
grams
pp. per Use synonyms
week
from 1979 to 2005.Use synonyms