
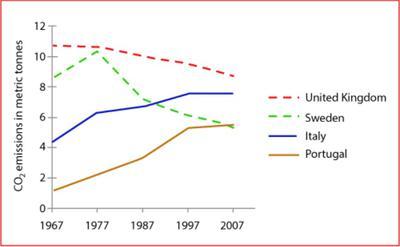
The line graph compares how much
co2
Correct your spelling
CO2
emissions
per person in four massive countries( France, Norway, Use synonyms
Spain
and Greece) between 1975 and 2015.
Use synonyms
Overall
, Linking Words
it is clear that
the individuals of France produced a great deal of carbon dioxide Linking Words
emissions
, the Use synonyms
the
other three countries over the period. Remove the redundancy
apply
While
in Greece Linking Words
emission
was lower than Correct article usage
the emission
Use synonyms
Spain
and Norway.
Turning to detail ,France started sharply in 1975 and produced approximately 11 Change preposition
in Spain
co2
Correct your spelling
CO2
emissions
, Use synonyms
then
it gradually dropped by 12 Linking Words
co2
in 2015. Regarding Norway , it Correct your spelling
CO2
begun
about 8 metric tons , Add the auxiliary verb
began
then
humans of Linking Words
this
country rapidly produced 10 metric tons of Linking Words
emissions
in 1985 and Use synonyms
afterwards
it dramatically declined by 5 metric tons of carbon dioxide in 2015. Add a comma
afterwards,
Spain
significantly grew by 4 from 1975 to 2005. Use synonyms
Spain
remains steady in the following 10 years. Use synonyms
In
Linking Words
contrast
Greece was the lowest over the period and started at 1t, and next considerably increased by 4. 2t between 1975 and 2015.Add a comma
contrast,