
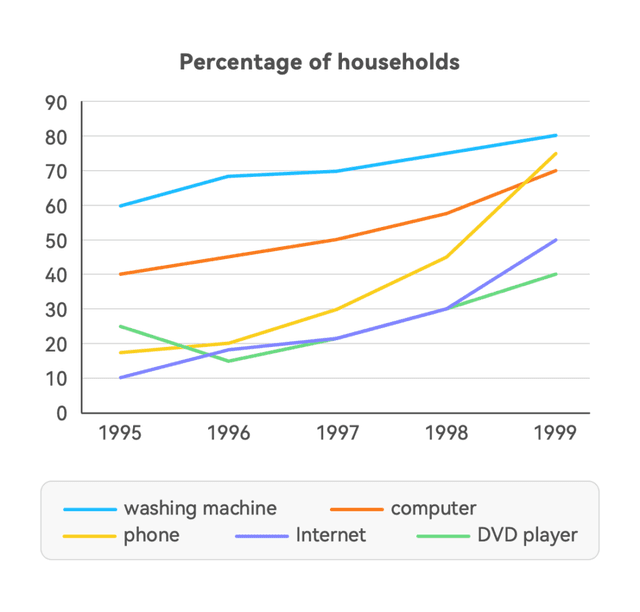
The given graph illustrates the proportion of
households
by providing different data Use synonyms
of
technology usage between 1990 and 1999.
Change preposition
on
Overall
, throughout the years, they experienced an increasing trend. Leading by the washing machine Linking Words
households
reached Use synonyms
a
highest percentage Change the article
the
while
the DVD player waste obtained the least percentage of wastes. Linking Words
Moreover
, the washing machine, computer, phone and internet Linking Words
households
witnessed a Use synonyms
gradually rose
, Replace the word
gradual rise
whereas
the Linking Words
dvd
player litters Correct your spelling
DVD
were fluctuated
.
Change to the active voice
fluctuated
have fluctuated
In addition
, Linking Words
the
washing machine Correct article usage
apply
households
Use synonyms
got
a peak number at 80% in 1999, Verb problem
reached
following
by the compter at about 75%, and the third position was phone Wrong verb form
followed
wastes
reached Fix the agreement mistake
waste
at
60% in 1999 which had dramatically Change preposition
apply
rose
from 20% in 1995. Wrong verb form
risen
However
, the Linking Words
dvd
player Correct your spelling
DVD
was
fluctuated by starting at approximately 25% in 1995, Unnecessary verb
apply
then
decreased to 15% in 1996 and gradually grew up to 40% in 1999.
Moving to the internet, starting with the least number of Linking Words
households
and Use synonyms
experiencind
decreased slightly Correct your spelling
experiences
at
20% in 1996. Change preposition
to
Finally
, rose gradually to 40% in 1999.Linking Words