
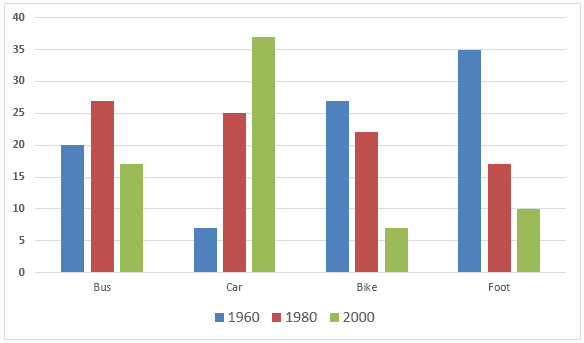
The graph shown above illustrates the numbers of various ways
people
travel to and from Use synonyms
work
in 1960, 1980, and 200. Each Use synonyms
stacks
represents the quantity used in each specific Change to a singular noun
stack
year
. Use synonyms
For instance
, blue shows the quantity during the Linking Words
year
1960, red shows the Use synonyms
year
1980, and Use synonyms
the
green shows the Correct article usage
apply
year
2000. Use synonyms
However
, as for the Y axis, let's assume that it draws the percentage of the Linking Words
people
using which specific means of transportation.
Picking up from the first group of stacked Use synonyms
collumns
, are the numbers on how many Correct your spelling
columns
people
commute using the bus. It's shown that Use synonyms
it's
peaked in the Unnecessary verb
it
year
1980, when Use synonyms
people
Use synonyms
uses
Change the verb form
use
bus
a lot more often. Correct article usage
the bus
Then
, Linking Words
on
the second group, it's shown that Change preposition
in
people
mostly use Use synonyms
car
to get to Add an article
the car
a car
work
Use synonyms
on
the Change preposition
in
year
2000, which makes Use synonyms
this
the most popular type of Linking Words
accomodation
used in that Correct your spelling
accommodation
year
. Moving on, the third group shows that Use synonyms
bike
Fix the agreement mistake
bikes
is
most often used in the Correct subject-verb agreement
are
year
1960. Use synonyms
Lastly
, walking on foot is the most Linking Words
way
Correct word choice
common way
of
Change preposition
for
people
Use synonyms
getting
around to Change the verb form
to get
work
Use synonyms
and
back in the Correct word choice
apply
year
1960.
In conclusion, Use synonyms
this
graph demonstrates the most popular way of commuting to Linking Words
work
and home clearly by basing it on the type of vehicle and the Use synonyms
year
it's documentedUse synonyms
from
. Change preposition
apply
This
data is beneficial for Linking Words
people
who Use synonyms
seeks
to use, analyze, and transform it into a report for monitoring or decision-making. Correct subject-verb agreement
seek
Additionally
, Linking Words
this
graph can Linking Words
also
be improved by adding even more types of Linking Words
transportations
to make it more comprehensive.Fix the agreement mistake
transportation