
The
given
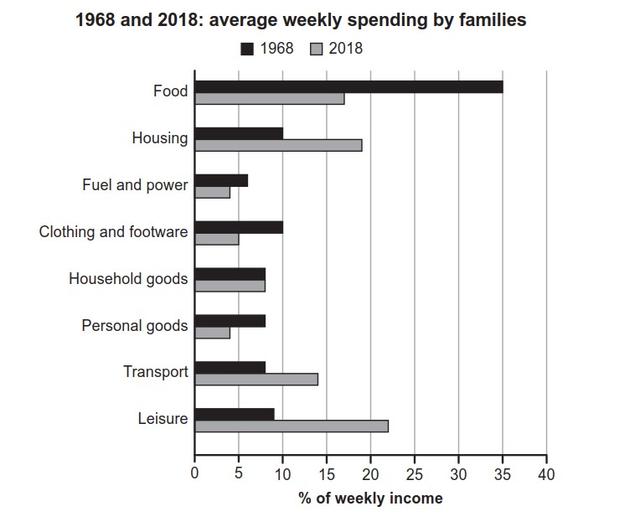
bar chart illustrates the average weekly expenditure by families in one country in 1968 and 2008.
Verb problem
apply
Overall
, people spent on Linking Words
food
the most in 1968 Use synonyms
while
people in 2008 spent on leisure the most.
Linking Words
To begin
with, in 1968, households spent 35% of their weekly income on Linking Words
food
and it was significantly higher compared to the other categories. Use synonyms
Following
Linking Words
this
, the percentage of housing and "clothing and footwear" was a tenth. Linking Words
Subsequently
, other sectors only showed a negligible rate, with below 10%. To be specific, families only spent about 9% on leisure. Linking Words
Moreover
, household Linking Words
goods
, personal Use synonyms
goods
, and transport reached about 8%. Use synonyms
Lastly
, the least spent sector, "Fuel and power" was approximately 6%.
Linking Words
On the other hand
, the expenditure towards Linking Words
food
decreased by half. Around 17% of weekly income was allocated Use synonyms
on
Change preposition
to
food
. Use synonyms
However
, the leisure and housing categories gained popularity. The rate was about 22% and 19%, respectively. Linking Words
Furthermore
, the figure for transport Linking Words
also
increased by almost double, to 14%. The percentage for household Linking Words
goods
remained the same. Use synonyms
Lastly
, "Fuel and power", "Clothing and furniture", and personal Linking Words
goods
showed a minor allocation.Use synonyms