
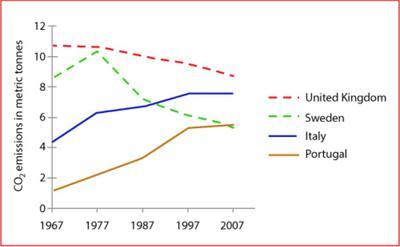
The line graph
comparisons
the rate of carbon dioxide emissions per Replace the word
compares
each
person among four different countries from 1967 to 2007.
Correct determiner usage
apply
It is clear that
both Italy and Portugal had an upward trend Linking Words
while
the Linking Words
UK
had a downward trend during four decades.
In 1967, the Use synonyms
UK
stood at the highest amount of carbon dioxide emission(10.3 Use synonyms
tons
) Use synonyms
Sweden
with 8.2 Use synonyms
tons
had the second stage and the Italian saw Use synonyms
third
stage with 4.1 Change the article
the third
tons
. Use synonyms
Linking Words
Finally
the Add a comma
Finally,
fewest
amount was for the Portuguese which was under 2 Correct word choice
lowest
tons
of carbon emissions.
During Use synonyms
first
decade the Change the article
the first
UK
experienced a slight decrease to 10.1 metric Use synonyms
tons
Use synonyms
Linking Words
however
, Italy and Portugal showed a remarkable surge to 6.2 and 3.5 Add the comma(s)
, however
tons
respectively. Use synonyms
Sweden
had Use synonyms
a
tremendous growth and peaked at 11 metric Remove the article
apply
tons
. In Use synonyms
second
decade, the Change the article
the second
UK
had a minimal decline of 10 Use synonyms
tons
Use synonyms
also
, Linking Words
Sweden
experienced a considerable drop from 11 to 7 Use synonyms
tons
. Both Italy and Portugal illustrate a moderate rise with 7 and 3 Use synonyms
tons
respectively.
From 1987 to 1997, Italy and Portugal followed an Use synonyms
Replace the word
increasing
increase
trend( 7.8 and 5 Replace the word
increasing
tons
) Use synonyms
whereas
the Linking Words
UK
and Use synonyms
Sweden
decreasedUse synonyms
Change preposition
by 1
1
Change preposition
by 1
Use synonyms
Fix the agreement mistake
ton
tons
constantly. Between 1997 to 2007, the Fix the agreement mistake
ton
Italianwith7.8
Correct your spelling
Italians with 7.8
tons
and the Portuguese with 5 Use synonyms
tons
remained at the same level Use synonyms
while
the Linking Words
UK
and Use synonyms
Sweden
Use synonyms
were
dipped by 1 Unnecessary verb
apply
tons
gradually.Use synonyms