
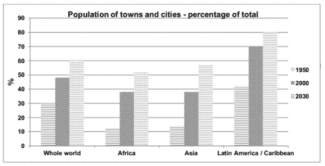
The bar chart illustrates data on how the number of people in cities increased from 1950 to 2000 and how much it will be in 2030
according to
the anticipation.
Linking Words
Overall
, what stands out from the graph is that the urban population was the highest in Latın America and the Caribbean and it is predicted that it will remain first in 2030.
Looking into detail,the figure for the whole world was one-third in 1950 after which it increased gradually and reached just under half.The projection shows that the share of urban residents in 2030 in the entire world will be twice as much as that in 1950 and will stand at 60%.The figures for Africa and Asia were approximately the same in 1950 at around one-tenth.Linking Words
While
the former is expected to rise fivefold and reach just above 50%, Linking Words
according to
the estimation,the latter will stand at about 55%.
Regarding the remaining part of the world,the percentage of city inhabitants in Latin America was the highest with a little more than 40%,after which it is predicted to grow substantially and finish at four-fifthsLinking Words