
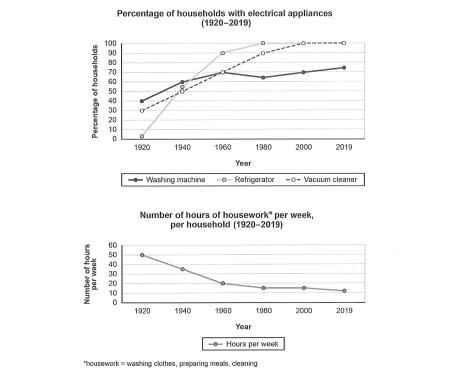
The line charts illustrate the proportion of electrical appliance ownership and the number of hours spent on doing chores
such
as washing clothes, preparing meals and cleaning in a particular country from 1920 to 2019.
Linking Words
Overall
, between 1920 and 2000, the percentage of households who owned refrigerators and vacuum cleaners rose steadily. Linking Words
Moreover
, the figure for washing machine owners saw a gradual rise from 1920 to 1960. From 1960 onwards the percentage of households who bought a washing machine fluctuated. With regard to the second graph, the amount of time spent on doing housework declined significantly over the entire period.
The first graph shows that the proportion of refrigerator and vacuum cleaner owners increased by 90% and 40%, respectively from 1920 to 1960. Linking Words
Similarly
, the figure for owning washing machines experienced a growth of 30% during the same period. Linking Words
However
, in the subsequent years, Linking Words
this
percentage fluctuated around 70%. The graph below demonstrates that the number of hours per week devoted to doing house chores decreased substantially from 50% to 10% during the whole period.Linking Words