
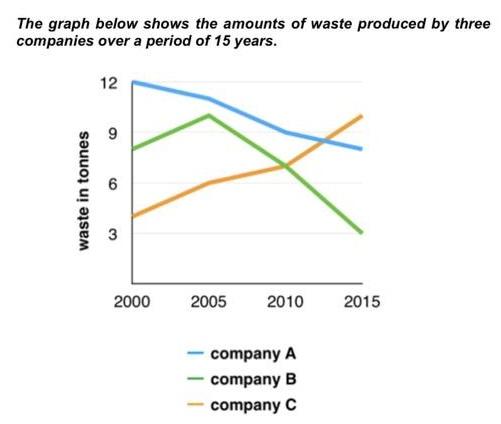
Presented for consideration is a line graph giving statistics pertaining to the
waste
produced by three different companies over 15 years.
Use synonyms
Overall
, it can be noticed that the Linking Words
waste
Use synonyms
company
Use synonyms
C
produced experienced a remarkable upward trend, Use synonyms
whereas
those for companies A and B saw a decline. Linking Words
Additionally
, not only increasing through the period but Linking Words
company
Use synonyms
C
's Use synonyms
waste
Use synonyms
also
became the highest number compared to the others.
Looking at the figures for Linking Words
company
Use synonyms
C
, which observed an increase in producing Use synonyms
waste
. To be more specific, its Use synonyms
waste
stood at roughly 5 Use synonyms
tonnes
in 2000, before increasing gradually to more than 9 Use synonyms
tonnes
in the period's end.
Moving on to the other companies were estimated to decrease over time. Regarding Use synonyms
company
Use synonyms
C
, its produced Use synonyms
waste
increased slightly from under 9 Use synonyms
tonnes
to approximately 10 Use synonyms
tonnes
in the following 5 years, Use synonyms
however
, Linking Words
this
number decreased sharply to just a mere 3 Linking Words
tonnes
by 2015. With respect to Use synonyms
company
A, its Use synonyms
waste
declined from 12 Use synonyms
tonnes
at the beginning to just around one-fourth of that throughout the period.Use synonyms