
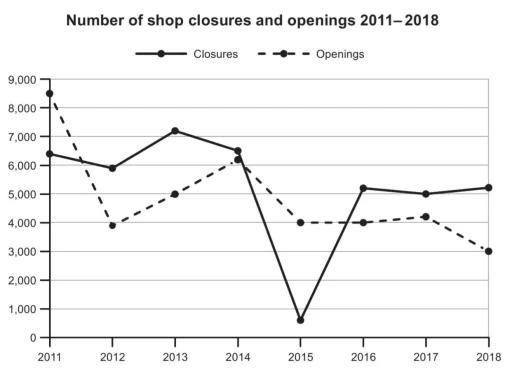
The line graph illustrates the total number of shop closures and opening of new shops in a specific country between the years 2011 and 2018.
Overall
, it can seen that the highest number of closures happened in the Linking Words
year
2015 Use synonyms
however
, openings were fewer by the end of the period.
On one hand , openings of retail shops were around 8500 in the Linking Words
year
2011 but drastically dropped in the next Use synonyms
year
2012 to 4000 and stood up to 6000 in Use synonyms
the
2014 , but stable between 2015 and 2017 4000, before it dropped to 3000 in 2018.
Change the article
apply
On the other hand
, the number of store closures was approximately 6200 in the Linking Words
year
2011, slightly dropping in the following Use synonyms
year
and rising to 7100 in 2013 but a significant decline in 2015 from 6500 to around 300 . Increase 5100 in the next Use synonyms
year
, maintained stead between 2016 to till the end of 2018 with 5100.Use synonyms