The chart below gives information about the number of social networking sites people used in Canada in 2014 and 2015. Summarise the information by selecting and reporting the main features, and make comparisons where relevan

The chart below gives information about the number of social networking sites people used in Canada in 2014 and 2015. 

Summarise the information by selecting and reporting the main features, and make comparisons where relevan
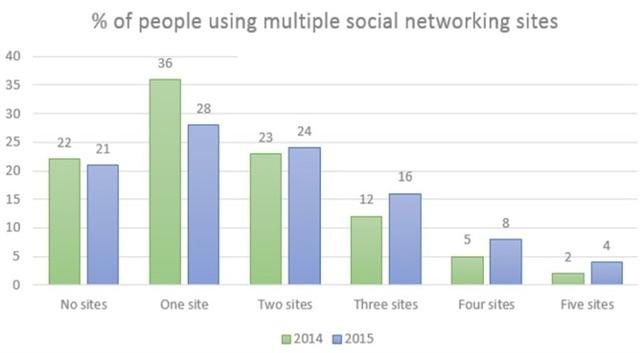
The bar graph illustrates the data about the number of six different social network section pupil usage in Canada between 2024 to 2015.
Overall
, one site used presented the highest amount in both years
while
five app uses showed a tiny proportion in the Canadian multiple networking sector.
According to
the graph, there were no
sites
people accounted for 22% and 21% in 2014 and 2015 .In one site humans were recorded the most significant amount by 36% and over by 25% in 2015.There were similar percentages of 23% and 24% during the time period by two scene uses.
Furthermore
, three
sites
showed by 12% in 2014 and they increased by 16% in 2015.
However
, four
sites
and five
sites
presented the smallest contribution of social network
sites
by 8% and 8%
in addition
to the lowest percentage by 2% and double in 2015 respectively.
To sum up
, the majority of one site uses multiple social networks
huge
Correct word choice
apply
show examples
and the number of five
sites
used accounted tiny proportion of usage in Canada.
Submitted by nimeshafernando126 on

Unauthorized use and/or duplication of this material without express and written permission from this site’s author and/or owner is strictly prohibited. Excerpts and links may be used, provided that full and clear credit is given to Writing9 with appropriate and specific direction to the original content.

Vocabulary: Replace the words sites with synonyms.
Vocabulary: The word "graph" was used 2 times.
Vocabulary: The word "presented" was used 2 times.
Vocabulary: The word "showed" was used 2 times.
Vocabulary: The word "amount" was used 2 times.
Vocabulary: The word "number of" was used 2 times.
Vocabulary: The word "percentages" was used 2 times.
Vocabulary: The word "proportion" was used 2 times.
Topic Vocabulary:
  • Comparative data
  • Utilization
  • Consecutive years
  • Overall trends
  • Proportion
  • Notable changes
  • Consistencies
  • Diversification
  • Summarize
  • Reflecting
What to do next:
Look at other essays: