
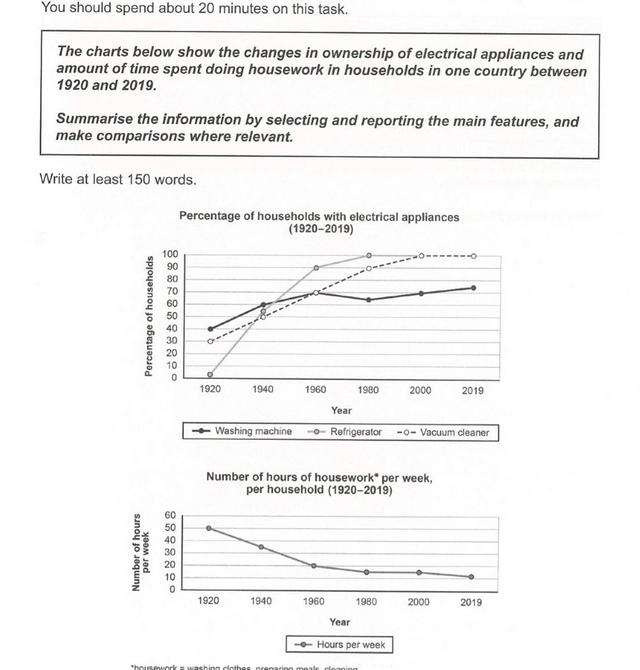
The line graph illustrates changes in the possession of electrical appliances and time spent doing housework in households in a particular nation between 1920 to 2019.
Overall
, it has an upward trend in ownership of washing machines, Refrigerators and vacuum cleaners. Linking Words
However
, Linking Words
downward
trend towards hours spent on housework per week.
The proportion of washing machines was 40 per Add an article
the downward
a downward
cent
in 1920 grew steadily to 60percent in 1940 and fluctuated between 1960 to 2000 Use synonyms
around
70 per Change preposition
to around
cent
, slightly Use synonyms
increase
over 72 per Wrong verb form
increasing
cent
in the year 2019.Use synonyms
whereas
, refrigerators and vacuum cleaners began at 0 and 30 per Linking Words
cent
in the beginning and grew drastically till 2000 where reaching the highest point in the graph with 100 % and remain the unchanged end of the year 2019.
Use synonyms
On the other hand
,hours spent on housework every week for washing clothes , preparing meals and cleaning have declined trend. Individuals spent 50 % in the year 1920 and fell drastically to 20 % in 1960 ,slowly declining till 2019 settling Linking Words
with
above 10 %.Change preposition
at