
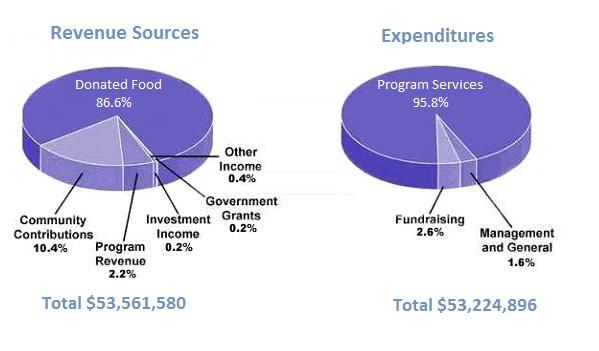
The following two pie graphs illustrate the revenue and expenditure sources of Youngster’s
Charity
located in the United States in 2016. There are six revenue streams and three expenditure flows.
On one hand, one of the major contributors to the Use synonyms
charity
is donated food at 86.6%. Use synonyms
Furthermore
, community sponsors are almost 10.4% compared to Linking Words
money
received from the program is 2.2%. Use synonyms
Consequently
, the other three categories Linking Words
such
as government grants, investment income and other income contributed less than 1% of the total Linking Words
money
received from the Use synonyms
charity
.
Use synonyms
On the other hand
, almost $ 51 million i.e. 95.8 % of the Linking Words
money
was spent on the program services. Use synonyms
However
, the funds spent on fundraising was close to $1.5 million and management and general contributed almost $ 600 thousand, in total that accounted for an insignificant percentage of 4.2.
In conclusion, the total Linking Words
money
received by the Use synonyms
charity
was $53. 6 million, which was only .6% more than the Use synonyms
money
spent in 2016.Use synonyms