
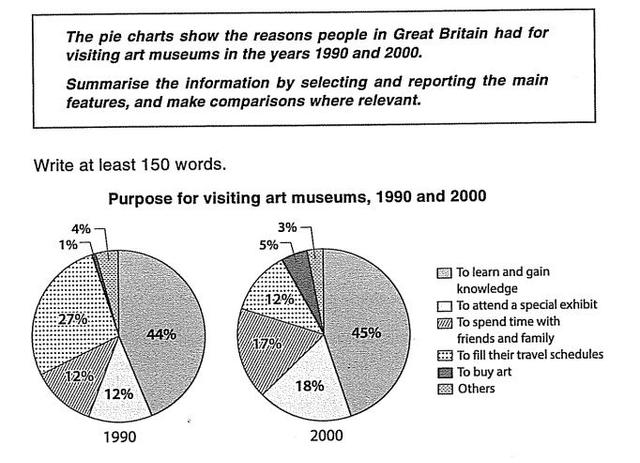
The pie charts illustrate the proportion of a variety of reasons
of
people for visiting Change preposition
apply
art
museums in the UK between 1990 and 2000.
Use synonyms
Overall
, Linking Words
it is clear that
most visitors are keen on learning and gaining knowledge Linking Words
while
only a few of them visit museums to buy Linking Words
art
or other ideas.
In the first place, 44% of individuals in 1990 went to galleries to study Use synonyms
art
whilst 24% just attended because it was on their schedules. The percentage of reasons for attending a special exhibit and spending their time with their intimates was the same, at 12%. The reason to buy Use synonyms
art
and others occupied 4% and 1% respectively.
In the second place, The studying purpose increased by 1% in 2000Use synonyms
Change preposition
apply
besides
, followed by special exhibit attendees and people who came with their friends and family, were about 18% and 17%. Planning dropped by 15% and became the fourth place. Linking Words
Moreover
, people who came to buy Linking Words
art
shot to 5% in 2000 and surpassed other reasons which registered at 3%.Use synonyms